According to the Centers for Disease Control and Prevention, the key to preventing harm to school employees, students and the environment is to establish a good occupational health and safety program.
From 2015 to 2020, an estimated 263,400 workers in K–12 schools sustained injuries on the job that required emergency department treatment, according to the National Institute for Occupational Safety and Health (NIOSH). These findings, based on data from the National Electronic Injury Surveillance System’s occupational supplement (NEISS-Work), highlight the nonfatal workplace injuries treated in U.S. emergency departments.
During this period, approximately 46.7 million individuals were employed in primary and secondary schools across the country, including school administrators, teachers, paraprofessionals, support staff, custodial workers and food service staff.
Key Insights from Injury Rate Analysis
The analysis provided important insights into the most at-risk school employees and the types and causes of their injuries, emphasizing the need for comprehensive safety measures to protect all members of the school community.
- Injury Rates: There were 56 injuries for every 10,000 full-time employees (FTEs) in schools, a lower rate compared with the overall workforce injury rate of 130 per 10,000 FTEs in 2020.
- Gender Disparities: Female school employees accounted for 69% (182,200) of these injuries. However, male employees had a higher injury rate of 66 per 10,000 FTEs, compared with 53 per 10,000 FTEs for females.
- Age Factors: Workers ages 45–54 experienced the highest number of injuries (68,500), followed closely by those ages 55–64 (68,400). The highest injury rates were found in employees younger than 25 and those ages 55–64, with rates of 77 and 76 per 10,000 FTEs, respectively.
Trends and Common Causes of Injuries
The number of emergency department-treated workplace injuries among school employees consistently declined over the six-year period, likely influenced by the COVID-19 pandemic and school closures in 2020.
- Injury Types: The most common injuries were to the head and face (69,000), followed by the arm, wrist and hand (59,800), and the leg, ankle and foot (58,700).
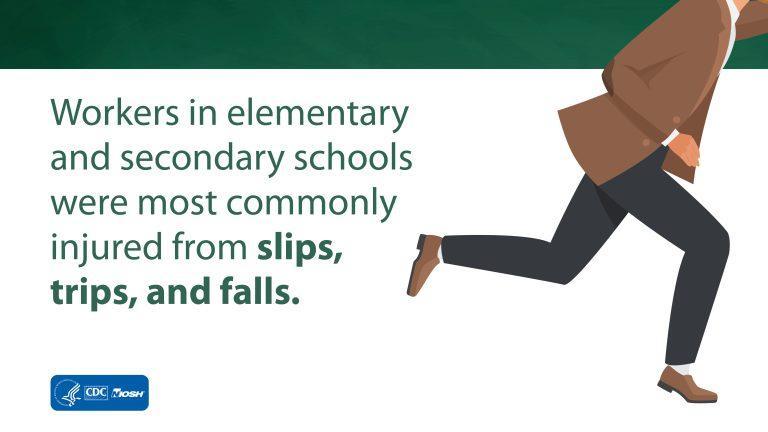
- Causes of Injuries: Falls, slips and trips were the leading causes, accounting for 67,700 injuries, with 78% of these falls occurring on the same level. Violence and other injuries by persons or animals were the second most frequent cause, responsible for 25% (65,600) of all injuries. Of these, 57% (37,400) were intentional injuries, primarily caused by students.
Need for Targeted Prevention Efforts
While the data provides only a partial picture of the total injuries, it underscores the need for targeted prevention efforts. Falls can be mitigated through measures such as nonslip flooring, adequate handrails and good housekeeping practices. Violence-related injuries, particularly those involving students, remain challenging, but could benefit from strategies used in other industries, like health care, to minimize and prevent workplace violence.
Despite the decline in injuries, ensuring the safety of school employees remains a critical concern. School leaders must use this data to implement comprehensive safety measures that protect all members of the school community.
Click here for more information to improve health and safety at your school.
Graphic courtesy of the Centers for Disease Control and Prevention.

